Published: March 2020 | Last Updated:March 2026
© Copyright 2026, Reddog Consulting Group.

Most CPG founders see marketplace saturation as a dead end, convinced too many competitors mean zero opportunity. This belief costs brands millions in missed growth. Saturation isn’t a wall blocking your path, it’s a map showing where others cluster and where gaps exist. Understanding what marketplace saturation actually measures transforms it from obstacle to strategic advantage. This article breaks down saturation metrics, reveals which channels offer hidden opportunities, and shows how CPG brands in the $500K to $20M range can scale profitably despite intense competition.
| Point | Details |
|---|---|
| Saturation as map | Saturation is a map showing where demand concentrates and where competitors cluster, turning a hurdle into a guide for growth. |
| Key saturation metrics | Track market penetration percentage, total SKU count, purchase frequency, new product success rates, and price elasticity to gauge saturation and identify opportunities. |
| Differentiate to win | Product differentiation and deeper channel presence help brands stand out in crowded markets and capture underserved demand. |
| Diversify channels | Diversifying across channels while controlling revenue concentration supports sustainable growth and reduces dependence on a single source. |
Marketplace saturation in CPG exists on a spectrum, not as a simple yes or no condition. It measures the relationship between competing SKUs and available consumer demand in a specific category. When numerous SKUs compete for limited demand, differentiation becomes challenging but remains achievable through strategic positioning.
High market penetration combined with low innovation signals true saturation. Categories where most households already purchase regularly and new product launches offer minimal novelty face the steepest competitive pressure. Coffee pods, for example, show high penetration with dozens of brands offering nearly identical formats, creating intense price competition and margin compression.
Founders must analyze saturation using data rather than assumptions. A category appearing crowded might still have underserved segments or unmet needs. Plant-based snacks seemed saturated in 2024, yet brands targeting specific dietary restrictions like low FODMAP or allergen-free found profitable niches. The key lies in identifying where demand exists without adequate supply.
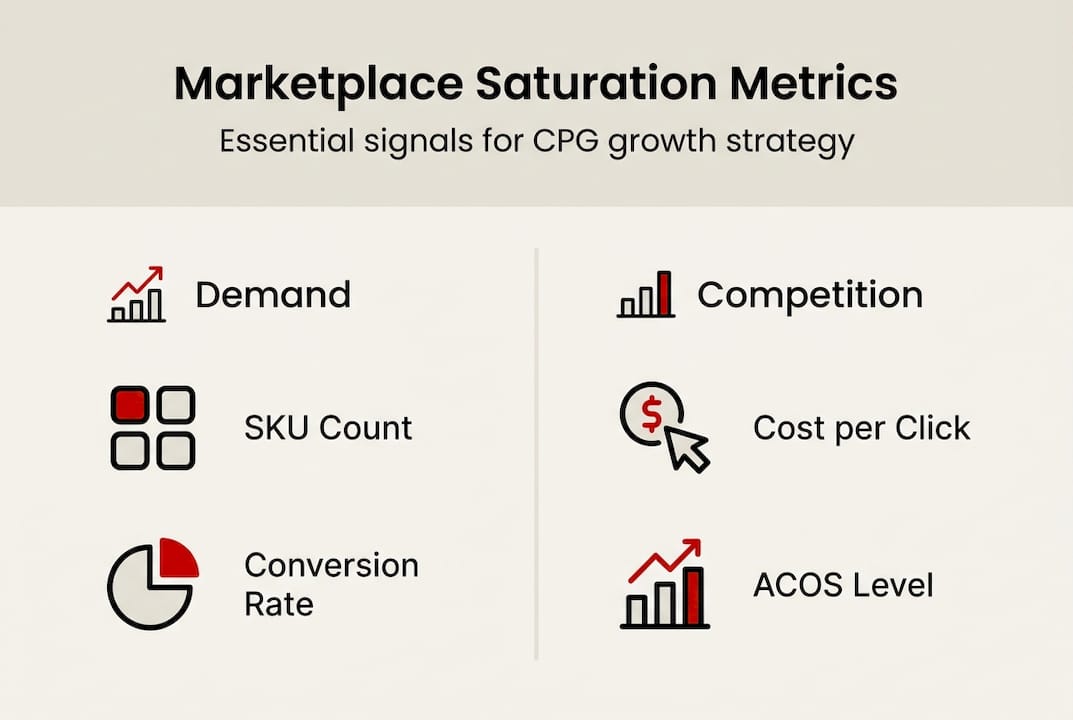
Effective marketplace management for CPG brands requires tracking five core indicators:
These metrics paint a complete picture of competitive intensity and opportunity zones. A category with 200 SKUs but only 40% household penetration offers more room than one with 50 SKUs at 85% penetration. Understanding this distinction separates founders who find growth from those who chase diminishing returns.
Pro Tip: Calculate your category’s SKU to demand ratio by dividing total active SKUs by annual category revenue in millions. Ratios above 15 typically signal saturation requiring niche differentiation rather than head-to-head competition.
“Saturation doesn’t eliminate opportunity. It redistributes it toward brands willing to solve problems competitors ignore.”
Quantifying saturation requires tracking specific metrics that reveal competitive pressure and margin sustainability. Four indicators matter most for CPG founders evaluating channel opportunities and category health.
SKU count versus consumer demand establishes the baseline saturation level. Categories with high SKU counts relative to total addressable market revenue face fragmented demand. When 300 brands compete for $50 million in annual sales, each brand averages $166,000, making profitability difficult without strong differentiation or operational efficiency.
Conversion rate trends show whether saturation is increasing or stabilizing. Declining conversion rates alongside rising costs signal intensifying competition as more brands fight for the same customers. Amazon CPG categories saw average CVR drop from 12.3% in 2023 to 10.8% in 2025, indicating buyers face more choices and decision friction.
Cost per click reveals advertising competition intensity. Rising CPC without corresponding revenue growth means you’re paying more to reach the same customers. This metric directly impacts customer acquisition cost and determines whether paid advertising remains viable for growth.
Advertising cost of sale measures profitability of customer acquisition. ACOS above 30% in most CPG categories indicates saturation pressure requiring either improved conversion efficiency or channel diversification. Brands stuck at 35% to 40% ACOS rarely achieve sustainable profitability without fundamental strategy shifts.
| Metric | Amazon trend | Walmart trend | Implication |
|---|---|---|---|
| Conversion rate | Declining 1.5% annually | Increasing 0.8% annually | Walmart offers less saturated opportunity |
| Cost per click | Rising 12% year over year | Rising 6% year over year | Amazon competition intensifies faster |
| ACOS | Averaging 32% to 38% | Averaging 22% to 28% | Walmart preserves margin better |
| SKU growth | 18% annual increase | 11% annual increase | Amazon adds competitors faster |
Channel comparison reveals critical strategic insights. Walmart’s less saturated marketplace allows brands to achieve stronger performance with lower advertising costs, making it attractive for margin-focused growth. Amazon’s higher saturation demands superior product differentiation and operational excellence to maintain profitability.
Pro Tip: Track your category’s average ACOS monthly and compare it to your own. If your ACOS runs 5 points above category average for three consecutive months, saturation is outpacing your competitive positioning and strategy adjustment is urgent.
Monitoring these four metrics quarterly provides early warning when saturation reaches levels threatening profitability. Founders who wait for revenue decline before recognizing saturation miss the optimal window for strategic pivots. The data tells you when to double down, when to diversify, and when to exit a channel before margin erosion becomes irreversible.
Succeeding in saturated marketplaces requires deliberate strategy focused on differentiation, channel discipline, and margin preservation. Brands that spread resources across too many channels or compete on price alone rarely achieve sustainable growth.

Product differentiation targeting underserved niches creates competitive moats in crowded categories. Rather than launching another vanilla protein powder, successful brands identify specific consumer needs competitors ignore. Plant-based innovations addressing allergen concerns or functional benefits like gut health support command premium pricing and loyal followings. The key is solving real problems for defined audiences, not creating marginally different versions of existing products.
Channel focus over breadth maximizes return on effort and capital. Attempting to sell everywhere dilutes resources and prevents achieving the depth required for channel success. Winning brands concentrate on three to five channels where they can build meaningful presence, optimize operations, and achieve velocity that attracts retail buyers and algorithm favor.
Scoring channels on critical success factors guides resource allocation:
| Channel | Product fit | Velocity | Margin | Scalability | Strategic value | Total score |
|---|---|---|---|---|---|---|
| Amazon | 8/10 | 9/10 | 5/10 | 7/10 | 8/10 | 37/50 |
| Walmart | 7/10 | 7/10 | 8/10 | 8/10 | 7/10 | 37/50 |
| DTC | 9/10 | 5/10 | 9/10 | 4/10 | 9/10 | 36/50 |
| Grocery wholesale | 6/10 | 6/10 | 7/10 | 9/10 | 6/10 | 34/50 |
| TikTok Shop | 8/10 | 8/10 | 6/10 | 5/10 | 7/10 | 34/50 |
This framework reveals where to invest for maximum impact. Two channels scoring 37 might warrant equal attention, while a channel scoring 28 should receive minimal resources regardless of perceived opportunity.
Maintaining gross margin discipline enables profitable scaling. Brands accepting 25% gross margins to win distribution rarely survive long term. Trade spend, slotting fees, and promotional pressure erode already thin margins, creating a treadmill of unprofitable volume. Successful brands set minimum margin thresholds of 40% to 50% and walk away from opportunities failing to meet this standard.
Pro Tip: Limit any single channel to under 30% of total revenue to prevent overdependence and maintain negotiating leverage. Channel concentration above 40% creates existential risk if algorithm changes, fee increases, or policy shifts suddenly impact performance.
Channel diversification isn’t about being everywhere. It’s about building sustainable presence in channels that collectively support your growth goals while preserving margin and operational sanity. The brands scaling profitably in 2026 master three to five channels rather than dabbling in ten.
Implementing these strategies requires discipline and patience. Results take six to twelve months to materialize as you build channel-specific expertise and operational rhythms. Founders chasing quick wins through promotional tactics or channel hopping rarely achieve the multichannel retailing success that creates enterprise value and sustainable competitive advantage.
Real-world channel dynamics create complexities beyond basic strategy frameworks. Understanding these nuances prevents costly mistakes and positions brands for sustainable growth despite marketplace saturation.
DTC channel saturation drives customer acquisition costs to unsustainable levels for most CPG brands. Facebook and Instagram ad costs increased 43% from 2023 to 2025 while conversion rates declined 18%. This combination makes DTC economics challenging for brands without exceptional lifetime value or viral organic growth. Founders must calculate true customer acquisition cost including all marketing spend, creative production, and attribution inefficiencies before committing significant DTC investment.
Amazon enforces per-unit pricing parity across all channels, eliminating the traditional strategy of using DTC for premium pricing while offering marketplace discounts. This policy forces brands to choose between protecting margin everywhere or accepting compressed margins to compete on Amazon. Many brands discover too late that Amazon’s fees, advertising costs, and pricing pressure combine to destroy profitability despite strong sales volume.
Channel chaos emerges when brands chase revenue without strategic guardrails. Opening new channels before mastering existing ones spreads teams thin, creates operational complexity, and prevents achieving the depth required for sustainable success. The solution is setting revenue concentration limits and prioritizing margin health over top-line growth.
Emergent brands win through disciplined execution rather than venture capital or brand equity. The playbook that works:
These tactical approaches separate brands that scale profitably from those that grow revenue while burning cash. The difference matters enormously when you’re self-funded or operating on limited capital.
Channel diversification strategies must account for operational capacity and team capabilities. A five-person team cannot effectively manage Amazon, Walmart, DTC, TikTok Shop, and wholesale simultaneously. Attempting this creates mediocre performance across all channels rather than excellence in a focused few.
Selecting the right omnichannel retail platforms becomes critical as you scale beyond two or three channels. Integration between inventory management, order routing, and financial reporting prevents the operational chaos that undermines profitability. Brands often underestimate the technology investment required to manage multiple channels efficiently.
Pricing pressure intensifies as saturation increases. Competitors desperate for sales velocity slash prices, forcing a decision: match the cuts and destroy margin, or maintain pricing and accept lower sales volume. Neither option feels good, but maintaining margin discipline preserves the financial resources needed to outlast competitors operating unprofitably. Many brands that slashed prices to maintain volume during 2024 and 2025 saturation pressure exited the market in early 2026 when cash reserves depleted.
Navigating these challenges requires clear-eyed assessment of your competitive position, financial capacity, and operational capabilities. The brands thriving in saturated marketplaces make hard choices about where to compete and where to walk away. This discipline, more than any tactical brilliance, determines who builds sustainable businesses versus who chases vanity metrics into insolvency.
Marketplace saturation doesn’t have to limit your growth. The strategies outlined here work, but implementation requires expertise in channel economics, operational optimization, and margin-first decision making. Most founders lack the time to develop this knowledge while running their businesses.
RedDog Group specializes in guiding CPG brands through exactly these challenges. We help brands in the $500K to $20M range build profitable growth strategies across Amazon, Walmart, and emerging channels like TikTok Shop. Our approach focuses on contribution margin analysis, channel selection frameworks, and operational clarity that turns competitive pressure into strategic advantage. We understand Texas retail dynamics and nationwide distribution, bridging marketplace performance with wholesale execution. If you’re navigating saturated categories and need expert guidance on channel diversification and profitable scaling, explore our omnichannel growth services to see how we can help.
Marketplace saturation occurs when numerous competing SKUs chase limited consumer demand in a specific category, making differentiation challenging and margin preservation difficult. It exists on a spectrum rather than as a binary state, measured by metrics like SKU count relative to demand, conversion rates, and advertising costs. High saturation doesn’t eliminate opportunity but redistributes it toward brands solving problems competitors ignore.
Track four key metrics: SKU count versus total category revenue, conversion rate trends over time, cost per click for paid advertising, and advertising cost of sale. Calculate your category’s SKU to demand ratio by dividing active SKUs by annual revenue in millions; ratios above 15 typically signal saturation. Compare your channel performance metrics to category averages monthly to identify when saturation is outpacing your competitive positioning.
Focus on product differentiation targeting underserved niches rather than competing on price in crowded segments. Concentrate resources on three to five channels where you can build meaningful depth instead of spreading thin across many channels. Maintain gross margin discipline with minimum thresholds of 40% to 50%, walking away from opportunities that fail to meet this standard. Score channels on fit, velocity, margin, scalability, and strategic value to guide resource allocation.
Limiting any single channel to under 30% of total revenue prevents overdependence that creates existential risk from algorithm changes, fee increases, or policy shifts. Channel concentration above 40% eliminates negotiating leverage and makes your business vulnerable to decisions outside your control. Balanced revenue distribution across three to five channels provides stability, flexibility, and sustainable growth that survives marketplace disruptions and competitive pressure.
Leave a comment: