Published: March 2020 | Last Updated:March 2026
© Copyright 2026, Reddog Consulting Group.

Most CPG brand founders track revenue religiously but can’t pinpoint which marketing dollars actually drive profit. A recent analysis shows brands improving ROI measurement cut unprofitable promotions by up to 40%, redirecting spend toward channels that genuinely move the needle. For brands in the $500K to $20M range navigating Amazon, Walmart, DTC, and wholesale simultaneously, this clarity separates sustainable growth from cash burn. Understanding how to measure marketing ROI transforms scattered spending into strategic investment, revealing exactly where your budget works hardest and where it quietly drains margin.
| Point | Details |
|---|---|
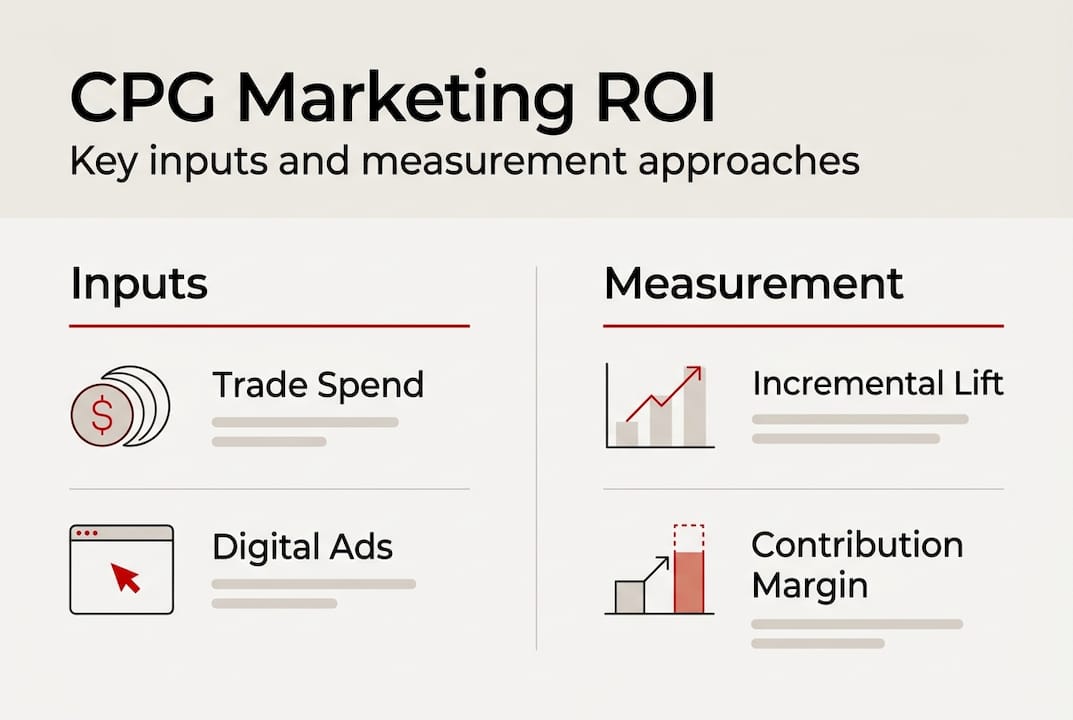
| Trade spend ROI formula | Calculate incremental contribution margin from lift above baseline and divide by total trade spend to isolate true promotional profitability. |
| Baseline and lift | Baseline velocity and lift separate normal sales from promotional increments to reveal actual impact. |
| ROMI fundamentals | ROMI measures how profitably marketing dollars perform and guides budget allocation. |
| Modeling integration | Pair trade spend ROI with marketing mix modeling to assess multichannel effects and optimize media mix. |
| Benchmarks and impact | CPG benchmarks show ROI often above 1.0x with top performers reaching several times investment and some campaigns up to 20x. |
Marketing ROI, often called ROMI (Return on Marketing Investment), measures how effectively your marketing spend generates profit. For CPG brands juggling trade promotions, retail media, and digital campaigns, ROMI answers the critical question: which marketing dollars actually pay back?
The standard ROMI formula looks straightforward: (Revenue Generated – Marketing Investment) / Marketing Investment × 100. Revenue Generated represents total sales attributed to the campaign. Marketing Investment includes all costs: media spend, trade dollars, creative production, agency fees. The result shows percentage return. A 200% ROMI means you earned $2 for every $1 spent, netting $1 in profit after recovering your investment.
CPG trade spend demands a more nuanced approach. Unlike digital ads where attribution is cleaner, trade promotions interact with baseline sales patterns, creating measurement complexity. The CPG-specific formula uses incremental contribution margin / trade spend to isolate true promotional lift. Contribution margin accounts for your actual profit per unit after variable costs, not just gross revenue. This distinction matters enormously when promotional pricing compresses margins.
Baseline velocity represents normal sales without promotion. Lift measures incremental units sold above baseline during the promo period. Net revenue subtracts promotional discounts and allowances from gross sales. Post-promo decay tracks the sales dip that often follows heavy promotions as customers stock up then pause purchases. These factors combine to reveal whether a promotion genuinely drove profitable incremental volume or simply borrowed future sales at a margin cost.
Here’s how to calculate trade spend ROI step by step:
Pro Tip: Track ROI not just as a percentage but alongside absolute incremental revenue for full context. A 300% ROI on $5,000 spend ($15,000 return) may matter less than a 150% ROI on $50,000 spend ($75,000 return) when prioritizing budget allocation.
This formula foundation sets the stage for understanding why trade spend ROI models need adaptation for CPG complexities compared to simpler digital ROAS metrics.
CPG trade spend typically consumes 15 to 25% of sales revenue, making accurate ROI measurement critical for profitability. Benchmark targets show ROI above 1.0x represents basic success, meaning you recovered your investment. Top performers achieve 1.7x to 3.2x ROI, while exceptional retail media campaigns can reach 20x returns. These benchmarks differ dramatically from SMB digital advertising, where ROAS of 2.5x to 3.8x is standard.

The distinction between trade spend ROI and digital ROAS matters. ROAS (Return on Ad Spend) typically measures gross revenue per dollar spent without margin considerations. Trade spend ROI must account for promotional pricing that reduces per-unit profit. A promotion generating 4x ROAS might deliver only 1.2x ROI after factoring in discounted margins and trade costs. This gap explains why brands relying solely on revenue metrics often discover promotions that look successful actually lose money.
| Metric Type | Calculation Basis | Typical Benchmark | Key Consideration |
|---|---|---|---|
| Trade Spend ROI | Incremental contribution margin / trade spend | 1.0x to 3.2x | Accounts for baseline and margin impact |
| Digital Paid Ads ROAS | Revenue attributed / ad spend | 2.5x to 3.8x | Gross revenue, may not reflect profitability |
| Retail Media ROI | Incremental sales / media investment | Potential 20x+ | Platform-specific attribution and incrementality |
Several factors complicate accurate trade spend ROI measurement. Baseline sales estimation requires analyzing historical patterns while adjusting for seasonality, competitive activity, and distribution changes. Promo lift calculation must isolate the promotion’s impact from other concurrent marketing or external events. Decay effects need tracking because heavy discounts often create a post-promo sales trough as customers work through inventory, making short-term lift measurements misleading.
Channel interactions add another layer. A retailer feature might boost sales, but did your trade spend drive the feature, or would it have happened anyway? Did the in-store promotion benefit from concurrent digital advertising that increased awareness? Disentangling these effects requires sophisticated measurement approaches beyond simple before-and-after comparisons.
Pro Tip: Avoid relying solely on ROAS without margin and baseline adjustments to prevent misleading conclusions. Always cross-reference revenue metrics with contribution margin analysis to ensure promotions actually contribute to profit, not just top-line growth.
Understanding these nuances prepares you for the next level: combining granular trade spend ROI with broader marketing mix models to capture total marketing impact across all channels simultaneously.
Marketing mix modeling (MMM) analyzes how different marketing inputs (trade spend, digital ads, TV, social media) contribute to overall sales. Unlike attribution models that assign credit to specific touchpoints, MMM uses statistical regression to estimate each channel’s incremental impact while controlling for external factors like seasonality, pricing, and competitive activity. This approach captures interactions between channels, revealing how trade promotions and digital campaigns amplify each other.
Incrementality geo-experiments provide causal validation. By running controlled tests where some markets receive a promotion while matched control markets don’t, you can measure true incremental lift. This method eliminates the baseline estimation guesswork inherent in before-and-after comparisons, delivering cleaner ROI measurements.
Granular trade spend ROI models excel at identifying unprofitable promotions at the SKU and retailer level. Brands applying these models typically improve promotional efficiency by 20 to 40%, cutting spend on low-performing tactics and doubling down on winners. MMM complements this by revealing broader patterns: which promotional types work best in which seasons, how digital advertising lifts baseline sales that make promotions more effective, and where channel conflicts might be cannibalizing sales rather than growing the category.
The benefits of combining these approaches include:
To integrate trade spend ROI with multichannel measurement effectively, follow these steps:
Accurate data collection underpins everything. Ensure sales data aligns with promotional timing, capture all trade spend components including hidden costs like display fees, and maintain consistent measurement periods across channels. Without clean data and aligned definitions, even sophisticated models produce unreliable guidance. Invest in data infrastructure and governance before layering on complex analytics.
Integrating trade spend optimization with conversion rate strategies creates a comprehensive growth system. As omnichannel complexity increases, brands must coordinate marketing and sales across channels while maintaining measurement rigor. These integrated approaches transform marketing from cost center to profit driver.
With measurement frameworks in place, real-world evidence demonstrates the tangible business impact of rigorous ROI tracking.
Empirical results validate the business case for investing in robust ROI measurement. One household CPG brand implemented integrated measurement across retail media and traditional channels, achieving remarkable outcomes:
Bayer’s integrated retail media measurement approach delivered a 32% incremental ROI lift, demonstrating how sophisticated attribution directly translates to bottom-line improvement when measurement guides optimization.
Broader case study data reveals consistent patterns of success:
| Brand/Category | Measurement Approach | Media ROI Increase | Incremental Revenue Impact | Key Insight |
|---|---|---|---|---|
| Household CPG Portfolio | Integrated retail media measurement | 42% improvement | $79 million incremental | Cross-retailer optimization unlocked hidden value |
| Bayer Consumer Health | Unified measurement framework | 32% iROI lift | Significant profit gain | Attribution clarity enabled smarter allocation |
| Multi-category CPG | Retail media ROI tracking | 20x ROI achieved | Substantial growth | Platform-specific strategies drove outsized returns |
These examples share common success factors. Brands moved beyond simple revenue attribution to measure true incrementality. They invested in measurement infrastructure that connected promotional activity to actual profit contribution. Most importantly, they acted on insights by reallocating budgets away from low-performing tactics toward proven winners.
The 42% media ROI increase and $79 million incremental revenue achieved by the household CPG portfolio demonstrates what’s possible when measurement drives decision-making. This wasn’t luck or category tailwinds. It resulted from systematically identifying which retail media investments delivered genuine incremental sales versus those that simply captured existing demand.
Improved ROI tracking supports informed budget allocation by revealing marginal returns across channels. When you know that the next dollar in retail media returns $3.20 while the next dollar in traditional trade spend returns $1.40, the allocation decision becomes clear. This granularity enables sustainable growth because you’re investing in activities that genuinely expand the business rather than borrowing from future periods or shifting sales between channels.
For brands in the $500K to $20M range, these case studies offer an encouraging roadmap. You don’t need enterprise-scale budgets to implement rigorous measurement. Start with granular trade spend ROI tracking on major promotions, layer in incrementality testing where feasible, and build toward comprehensive MMM as data and resources allow. Even partial implementation delivers meaningful improvements, with full integration unlocking the outsized gains demonstrated in these cases.
These results illustrate attainable ROI improvements from applying the methodologies discussed throughout this guide. Brands that commit to measurement rigor consistently outperform those relying on intuition or surface metrics. The question isn’t whether to invest in ROI measurement, but how quickly you can implement it to capture similar growth opportunities.
Building customized ROI models and navigating multichannel complexity requires specialized expertise. Partnering with consultants who understand CPG economics, retail dynamics, and marketplace performance accelerates your measurement capabilities while avoiding costly missteps.
RedDog Group works exclusively with CPG brands in your revenue range, focusing on contribution-margin-first strategies across Amazon, Walmart, DTC, wholesale, and distribution. We help you build the measurement infrastructure that reveals true channel profitability, identify where margin leaks hide in promotional spending, and optimize marketing investment for sustainable growth rather than vanity metrics.
Our omnichannel growth services integrate trade spend optimization, ecommerce performance, and retail media strategies into a unified framework. We don’t just measure ROI; we help you act on insights to reallocate budgets, negotiate better trade terms, and scale tactics that genuinely drive profit. Explore our CPG retail growth offer to see how we’ve helped brands like yours achieve measurable ROI improvements and accelerate profitable expansion.
With professional support, you can implement the measurement strategies discussed here faster and more effectively, turning marketing from a cost center into your most powerful growth lever. Let’s address common questions to further clarify how to approach marketing ROI measurement in your CPG business.
Measuring ROI identifies which marketing efforts generate profits and which quietly drain resources, enabling smarter budget allocation. Without rigorous measurement, brands often perpetuate unprofitable promotions based on revenue growth that doesn’t translate to actual profit. ROI tracking prevents the inefficient spending that’s particularly common in complex CPG promotion environments where baseline sales, promotional pricing, and channel interactions obscure true performance.
Complex baseline sales estimations and promotional lift calculations complicate trade spend ROI models, requiring sophisticated analysis to isolate incremental impact from natural sales patterns. Attribution across multiple channels presents another hurdle, as promotions, retail media, digital advertising, and in-store activities interact in ways that simple before-and-after comparisons can’t capture. Combining granular trade spend ROI analysis with marketing mix modeling and incrementality testing addresses these challenges but demands clean data and analytical capabilities many emerging brands lack initially.
Focus on granular trade spend ROI models that track baseline-adjusted lift and contribution margin rather than gross revenue to ensure profitability assessment. Complement promotion-level analysis with marketing mix modeling that captures channel interactions, seasonality, and external factors affecting sales. Run geo-controlled incrementality experiments on major promotional tactics to validate assumptions and refine baseline estimates. Most critically, ensure clean, aligned sales and marketing data across all channels, as measurement accuracy depends entirely on data quality and consistent definitions.
Aim for trade spend ROI above 1.0x as a minimum threshold, with top-performing brands achieving 1.7x to 3.2x or higher through rigorous optimization. SMB digital advertising campaigns typically deliver 2.5x to 3.8x ROAS, though remember this measures gross revenue rather than profit-adjusted returns. Retail media can potentially reach much higher multiples, with documented cases showing 20x ROI when targeting and measurement align effectively. Your specific benchmarks depend on category dynamics, competitive intensity, and growth stage, but consistently tracking performance against these ranges reveals whether your marketing investment generates adequate returns or requires reallocation.
Leave a comment: