Published: March 2020 | Last Updated:March 2026
© Copyright 2026, Reddog Consulting Group.

The retail analytics market is projected to quadruple to $43.31 billion by 2034, underscoring the critical role KPIs play in modern retail strategy. Yet many CPG brand founders struggle to translate data into actionable insights across Amazon, Walmart, DTC, and wholesale channels. This guide reveals how to select, measure, and optimize the KPIs that truly drive multichannel profitability and sustainable growth.
| Point | Details |
|---|---|
| KPIs are measurable metrics essential for monitoring retail performance across all channels | They transform raw data into strategic insights that guide decision-making and resource allocation |
| Multichannel retail demands integrated data systems to track online and offline performance | Fragmented data creates blind spots that hide margin leaks and prevent optimization |
| Strategic KPI selection aligned with business goals drives profitability more than vanity metrics | Focus on outcome-based KPIs like Cost-to-Serve and OTIF rather than impressions or clicks |
| Supply chain KPIs including OTIF, Visibility Score, and Cost-to-Serve improve operational efficiency | These metrics reveal systemic issues and enable proactive margin protection |
| KPI-driven strategies deliver measurable ROI improvements and revenue acceleration | Real CPG brands achieve 15X+ ROI and unlock millions in incremental revenue through KPI mastery |
The retail analytics market growth to $43.31 billion signals a fundamental shift in how CPG brands compete. Data-driven decision-making has evolved from optional to essential. KPIs provide measurable values reflecting the effectiveness of business activities, helping firms adapt quickly to market changes.
For CPG brands operating across Amazon, Walmart, DTC, and wholesale channels, KPIs translate complex data into clear performance indicators. They measure critical goals like market share expansion, sales velocity, and contribution margin by channel. Without KPIs, brands operate blind, making decisions based on intuition rather than evidence.
Consider the difference between vanity metrics and meaningful KPIs. Vanity metrics like social media impressions or website visits may look impressive but rarely connect to profitability. Meaningful KPIs like Cost-to-Serve per channel or inventory turnover directly impact your bottom line.
Key reasons KPIs matter more than ever:
“KPIs aren’t just numbers on a dashboard. They’re the language of retail strategy, translating operational reality into actionable decisions that separate profitable brands from those bleeding margin.”
Integrating retail analytics for growth transforms how you evaluate channel performance, pricing strategy, and inventory allocation. The brands winning in 2026 treat KPIs as strategic assets, not administrative tasks.
Most CPG brands face a disconnect between online and in-store data that prevents a complete customer view. Your Amazon sales data lives in Seller Central, Walmart performance sits in Retail Link, DTC metrics scatter across Shopify and Google Analytics, and wholesale orders arrive via email or EDI. This fragmentation makes unified KPI tracking nearly impossible without deliberate integration.
Privacy regulations compound these challenges. New cookie regulations limit web tracking, affecting how you measure marketing effectiveness across channels. Traditional attribution models break down when third-party cookies disappear, leaving gaps in your customer journey data.
The solution involves voluntary customer preference sharing. When customers willingly provide data in exchange for personalized experiences, you bypass tracking limitations while enhancing engagement. This approach respects privacy regulations while maintaining measurement capabilities.
Critical data integration obstacles:
Pro Tip: Invest in analytics tools that adapt automatically to evolving privacy laws rather than building custom solutions that become obsolete. Prioritize platforms offering pre-built connectors for Amazon, Walmart, Shopify, and major wholesale EDI systems.
Data consolidation becomes your competitive advantage. Brands that solve integration early gain clarity on which channels actually contribute to profit versus which ones subsidize growth at margin’s expense. This visibility enables strategic resource allocation rather than spreading budget equally across channels.
Implementing strategies to increase online visibility alongside robust offline to online integration creates the foundation for accurate multichannel KPI measurement.
Selecting the right KPIs separates strategic brands from those drowning in data. For CPG brands scaling across multiple channels, three supply chain KPIs deserve priority attention.

On-Time In-Full (OTIF) measures delivery performance against retailer requirements. While OTIF remains a core compliance metric, it needs contextual analysis to reveal systemic issues. A 95% OTIF rate looks strong until you realize that 5% failure costs you $50,000 in chargebacks annually.
Cost-to-Serve by channel provides clearer profitability insights than Cost per Unit calculations. This KPI captures the true expense of servicing each retail channel, including fulfillment fees, storage costs, returns processing, and customer service overhead. Recalculate quarterly as channel economics shift.
Visibility Score tracks your ability to monitor inventory across the supply chain. Components include real-time location tracking, predictive stockout alerts, and demand forecast accuracy. Target minimum thresholds of 90% inventory visibility and 85% forecast accuracy.
| KPI | Definition | Target Benchmark | Why It Matters |
|---|---|---|---|
| OTIF Rate | Percentage of orders delivered on-time and complete | 95%+ for major retailers | Prevents chargebacks and maintains retailer relationships |
| Cost-to-Serve | Total cost to fulfill orders by channel | Varies by channel | Reveals true channel profitability beyond gross margin |
| Visibility Score | Real-time inventory tracking capability | 90%+ visibility | Enables proactive inventory management and prevents stockouts |
| Revenue Growth Rate | Quarter-over-quarter sales increase | 15-25% for growth brands | Measures market traction and scaling velocity |
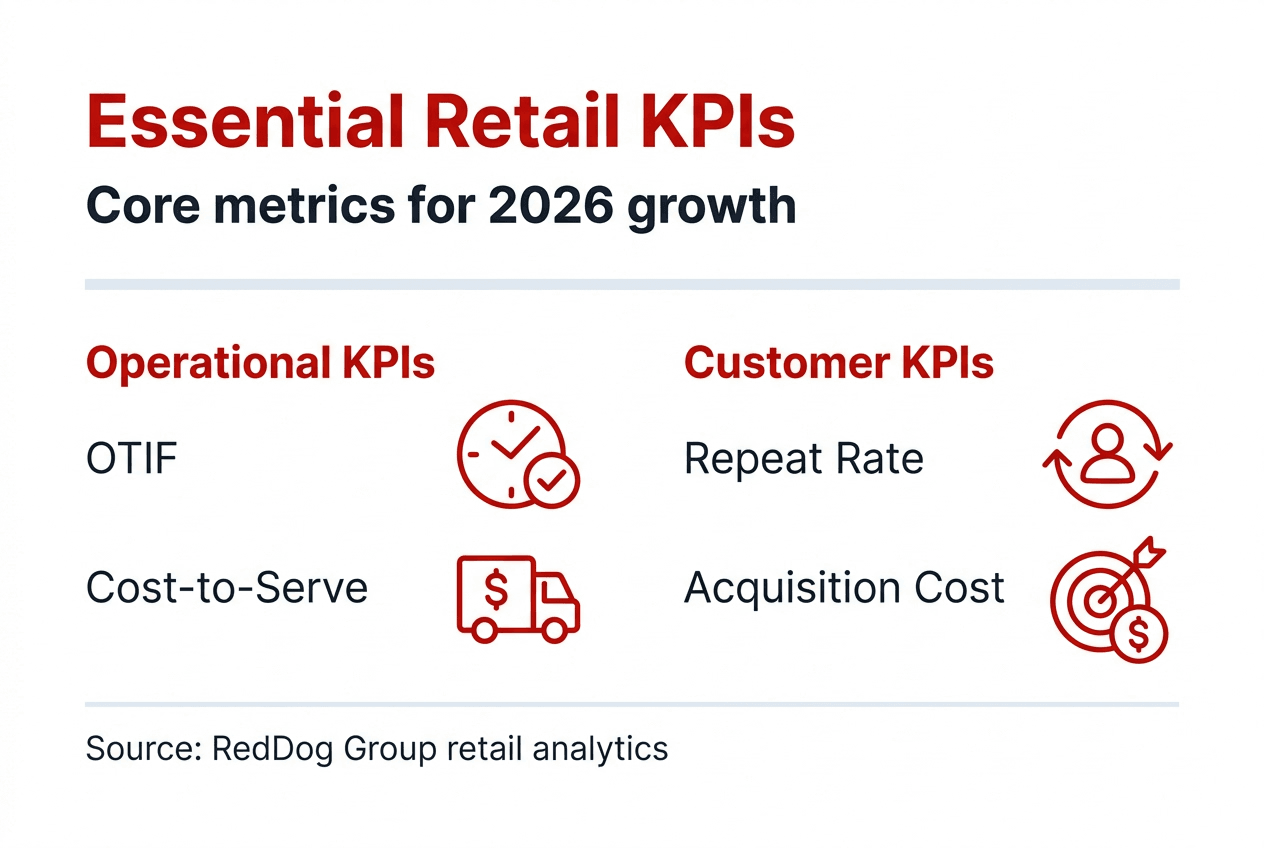
Customer-focused KPIs complement operational metrics. Track customer acquisition cost by channel, repeat purchase rate, and average order value. Segment these metrics by customer cohort to identify your most profitable customer profiles.
Pro Tip: Root cause analysis transforms OTIF from a compliance checkbox into operational intelligence. When OTIF drops, investigate whether the issue stems from supplier delays, warehouse capacity, carrier performance, or demand forecasting errors. This diagnostic approach prevents recurring problems.
Implementing systems to track sales performance across channels ensures you capture the granular data these KPIs require. Without channel-specific tracking, you’ll struggle to calculate accurate Cost-to-Serve or identify which channels drive profitable growth.
KPI mastery translates directly into financial performance. Real CPG brands demonstrate this connection through measurable results that go far beyond vanity metrics.
A multi-category pancake brand achieved 15.2X ROI on subscription investment by focusing on customer lifetime value KPIs rather than initial acquisition costs. By tracking repeat purchase behavior and subscription retention rates, they optimized their model for long-term profitability.
A household CPG portfolio improved media ROI by 42%, unlocking $79 million in incremental revenue through KPI-driven campaign optimization. They aligned advertising spend with sales lift metrics rather than impression-based measurements, fundamentally changing how they allocated marketing budget.
A fast-growing beverage brand scaled to approximately $2 billion acquisition value by leveraging platform analytics that surfaced actionable KPIs across distribution channels. Their success stemmed from obsessive focus on contribution margin by channel rather than chasing top-line revenue growth.
Implementing KPI-driven revenue strategies:
| Brand Category | Primary KPI Focus | Result | Timeline |
|---|---|---|---|
| Pancake Mix | Customer LTV, Subscription Retention | 15.2X ROI | 18 months |
| Household CPG | Media Efficiency, Sales Lift | 42% ROI improvement, $79MM revenue | 12 months |
| Beverage | Contribution Margin by Channel | ~$2B acquisition value | 36 months |
“The brands that win don’t just track KPIs. They build organizational discipline around acting on KPI insights, making weekly adjustments that compound into transformational results.”
Common pitfalls include fixating on vanity metrics that make dashboards look impressive without driving decisions. Impressions, clicks, and social followers matter far less than conversion rates, customer acquisition costs, and contribution margins. Focus ruthlessly on outcome-based KPIs tied to cash flow and profitability.
Leveraging tools to analyze sales data for multichannel growth provides the analytical foundation these strategies require. Without proper analysis capabilities, even perfect KPI selection fails to generate actionable insights.
Mastering KPIs requires more than understanding definitions. It demands systems, expertise, and continuous optimization that many emerging CPG brands struggle to build internally.
RedDog Group specializes in helping $500K-$20M CPG brands implement KPI-driven growth strategies across Amazon, Walmart, TikTok Shop, DTC, and wholesale channels. We focus on contribution-margin-first approaches that reveal where your channels actually generate profit versus where they disguise margin leaks.
Our consulting services translate KPI complexity into operational clarity. We help you select the right metrics for your growth stage, build tracking systems that actually work, and create decision frameworks that turn data into profitable action. Whether you’re navigating Amazon FBA fee changes, Walmart marketplace expansion, or wholesale distribution complexity, we bring analytical rigor focused on measurable results.
Explore how omnichannel growth strategies can accelerate your brand’s profitability. Partner with experts who understand both marketplace economics and physical retail realities, bridging digital performance with wholesale execution.
OTIF Rate, Visibility Score, Cost-to-Serve by channel, Revenue Growth Rate, and customer engagement metrics form the foundation. Your specific priorities depend on business goals, whether you’re optimizing for market penetration, profitability improvement, or acquisition readiness. Start with 5-7 KPIs rather than attempting to track everything.
Invest in unified analytics platforms that adapt automatically to evolving privacy regulations and offer pre-built connectors for major retail channels. Encourage voluntary customer preference sharing through value exchanges like personalized recommendations. Implement offline-to-online integration strategies that bridge in-store and digital data without requiring custom technical builds.
KPIs align marketing investments with specific business outcomes rather than vanity metrics. By measuring sales lift, contribution margin impact, and customer acquisition costs, you identify which campaigns genuinely drive profitability. Brands focusing on outcome KPIs saw 15% sales increases by continuously optimizing based on performance data.
Avoid vanity metrics like impressions or social followers that lack connection to revenue or profit. Understand how KPIs are calculated to prevent misinterpretation that leads to poor decisions. Focus exclusively on KPIs tied to business outcomes such as contribution margin, customer lifetime value, and inventory velocity. Tracking too many KPIs creates analysis paralysis rather than actionable clarity.
Leave a comment: